DNA Clustering
How I use a newer approach to DNA matching that can make a big difference.

There are two tools I want to talk about today that perform shared clustering. Many have written about the tools themselves, but I'm going to talk about how I use the tools with my own clusters.
Shared match clustering is a useful technique for locating where in your family background matches might be located, without having to go through the hassle of checking shared matches one-by-one.
Genetic Affairs (Evert-Jan Blom)
The first tool will probably be the easiest to get into for someone just starting out due to the simplicity of obtaining data from your Ancestry, 23andMe, or FamilyTreeDNA accounts. This is both a timesaver and a risk - you have to put your login information into the hands of Genetic Affairs. They claim to be security-conscious, but there is always a risk of compromise. That said, according to their FAQ, for Ancestry accounts there is a roundabout way to prevent your main login data from being used:
With respect to AncestryDNA, it is possible to use a separate dummy account. By employing the sharing AncestryDNA results it is possible to allow your separate account to have access to your DNA matches. By employing this system, there is no risk of unauthorized access to your raw DNA data.
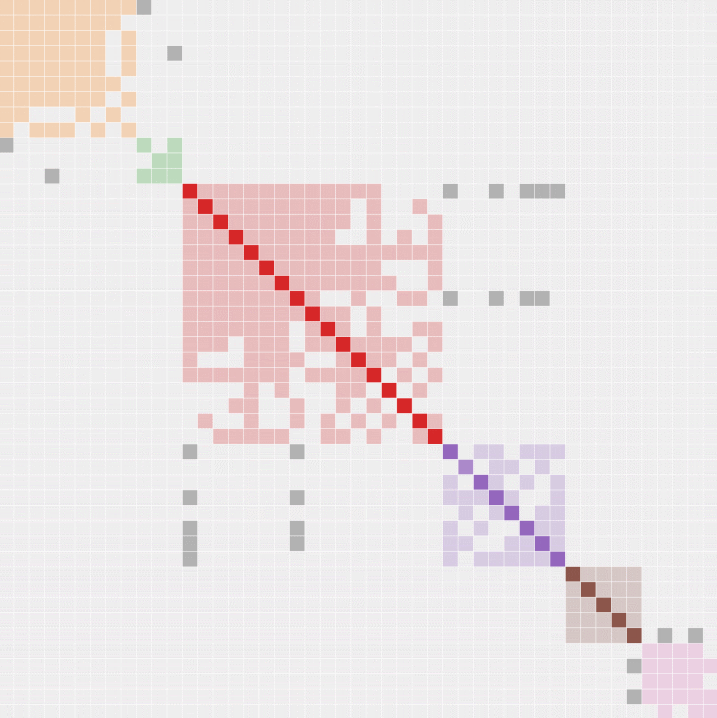
If the risks are acceptable to you, this tool provides some very useful functionality. I'll be focusing on its AutoClustering. Genetic Affairs offers examples of how their AutoClustering reports work, here and here, and the output will look something like this:

In the actual report, names of matches appear along the vertical axis and the same names appear along the horizontal axis. The diagonal line shows where the same names intersect and all other points show the way matches intersect each other (shared matches). This ends up producing clusters of matches who share each other as matches, and the above colour-coded chart is a means of visualizing those clusters.
Genetic Affairs provides a new user with a certain number of credits which are consumed as processing time is used to perform analyses. There are more than enough credits starting out to perform a variety of analyses on all main DNA websites. One needn't even enable the daily, weekly, or monthly updates to produce an AutoCluster analysis - there is a simple button that appears in the Profiles display.

The default settings should be sufficient for a first try. In my later attempts, I increased the starting value and decreased the stopping value to include more matches, but be warned: too many matches and the report's fancy animation will overwhelm your web browser. It would be nice to have an option to generate the report without the animation.
After generating the reports, it's helpful to go over the names list and get a sense of what clusters tend to belong to which names. While clustering shows shared DNA rather than shared family members, there tends to be a strong correlation with the latter. Here's the result for my own report:

And here is the result with my mother's data:

These are generalizations based on what I know of who is in each cluster. I can now look at the names of those matches who I haven't figured out my connection with and get a sense of where in my tree they are likely to fit based on proximity to matches I am already familiar with. In my mother's data, there are more question marks on the listed clusters because she is a closer match to people who are more distant and haven't been connected to our tree yet, leaving more of the clusters entirely unknown.
For those dealing with endogamy (inter-marriage) in their family backgrounds, such as most of us Ashkenazi Jews, we need to be careful not to set our match thresholds too low, or we end up with something that looks more like this:

That AutoCluster is based on my 23andMe data, with thresholds set too low. The pink blob represents my maternal line in its entirety, clusters completely indistinguishable. Endogamy means I match a lot more people genetically on that branch than I would match in a typical non-endogamic family, resulting in a very high number of distant but similar genetic cousins which, at this genetic distance, the GA tool has difficulty sorting through. There are ways of sifting through some of the endogamous matches but a key factor is not trying to directly match people more genetically distant than about third-cousin.
Along with the reports, sent to your email, GeneticAffairs will also send you a number of .csv files, some of which can be reused in other tools.
MyHeritage AutoClustering
I learned while working on this post that MyHeritage recently contracted Evert-Jan Blom to design a version of his AutoClustering tool specific to their service. It now appears under the "DNA Tools" option in the DNA top menu.

It's not particularly configurable but appears to produce reasonable (and pretty) results which, like the Genetic Affairs tool, are sent to you via email. They display using the same animated HTML grid GA uses.

I haven't yet had a chance to do any extensive analysis of my results from MyHeritage's AutoClustering, but of all the DNA sites I perhaps know the least about my matches on MyHeritage, so most of these clusters are question marks.
Shared Clustering (Jonathan Brecher)
This tool exists in the form of a Windows application which is available through the Shared Clustering wiki on GitHub. There is also a Shared Clustering User Group on Facebook where announcements are made about new releases.
The Shared Clustering tool currently requires the use of a third-party tool to download data from Ancestry, 23andMe, and FamilyTreeDNA in the form of .csv files. There are two tools commonly used to obtain those files:
- DNAgedcom Client - once subscribed to DNAgedcom, they provide a Windows application that can be used to download data from all the main sites. The client sometimes has to run for days to obtain all the necessary data, but the data is comprehensive and the files can be used both on DNAgedcom and for other purposes;
- Genetic Affairs - the .csv files provided by GA are usable in Shared Clustering as well. They will only contain as many matches as the GA AutoCluster reports themselves, so this may or may not provide additional benefit depending on what one is trying to accomplish.
Unlike Genetic Affairs, the Shared Clustering application will generate an Excel spreadsheet that can be edited and manipulated. It does not colour-code the matches but provides a gradient of match strength where the data is available. Below is a chart of my match data set to a lower limit of 40cM (for a clean visual):

Similar to the data from Genetic Affairs, a good starting point is to label blocks where there are known matches based on common ancestors. Here's a rough labeling of my 40cM chart:

Here we can see my paternal side taking up the bulk of the chart space - many more people have done genetic testing on that side of the family, and many more of my connections are known. My maternal, Jewish side takes up the bottom right corner of the chart. To find out more about the Jewish side of my chart I need to use lower threshold matches.
It's clear my half-sister's matches are on my paternal, non-Jewish side and appear as a vertical and horizontal line spanning only the territory where we have matches in common and intersecting where we match. Likewise, my mother's matches appear as intersecting lines spanning my Jewish matches in the bottom right. So much more of my grid is devoted to my paternal matches due to far more members on that branch of at least 40cM distance of me who have completed genetic testing.
This becomes a lot more messy in cases of endogamy. The intersecting point labeled "My mother" in the above 40cM chart, when set to 20cM, produces a gray mess when zoomed out and somewhat indistinct clusters:

This is a clear case of endogamy affecting the chart due to sharing of small portions of DNA by many Ashkenazi Jewish people whose ancestors intermarried frequently. The Shared Clustering tool, unlike the Genetic Affairs tool, gives an idea of strength of the relationships, allowing me to continue to see some clusters in the noise.
As I'm only genetically half-Jewish, endogamy only accounts for a portion of my clustering chart. Take, for example these portions which are from parts of my family that were not particularly endogamous, at the exact same zoom level as the above chart:

Jonathan has a brief section of the wiki devoted to endogamy.
Names I find as members of clusters in my clustering chart, I take note of (sometimes annotating the match directly in Ancestry) and this gives me a good idea of where to look in their family trees or in my own to locate them.
I hope this article proves helpful to some! Please give the instructions and advice in the wiki a thorough review if planning to get into DNA clustering.